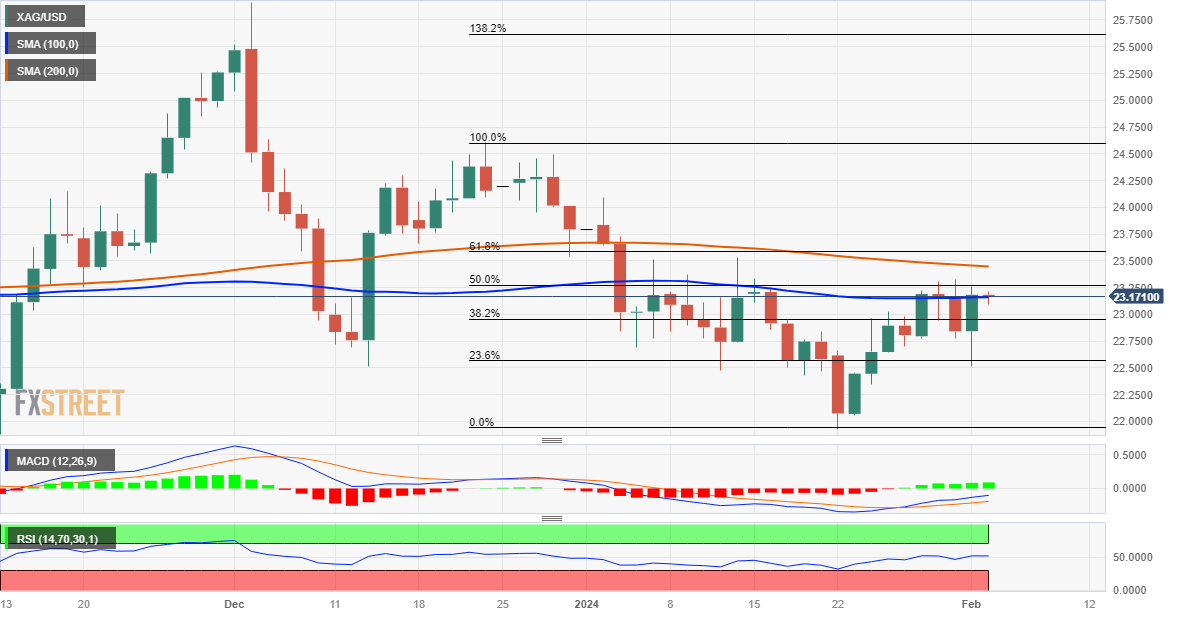
Silver Price Analysis: XAG/USD consolidates around 100-day SMA, below 50% Fibo.
- Silver oscillates in a narrow trading band just below the 50% Fibo. level on Friday.
- The technical setup favours bullish trades and supports prospects for further gains.
- A convincing break below the $22.55 area is needed to negate the positive outlook.
Silver (XAG/USD) struggles to capitalize on the previous day's solid recovery from the $22.50 region, or a one-week trough and oscillates in a narrow trading band through the first half of the European session on Friday. The white metal currently trades around the $23.15 region, nearly unchanged for the day, as traders keenly await the release of the US monthly jobs report (NFP) before placing fresh directional bets.
From a technical perspective, the XAG/USD, so far, has been struggling to break through a resistance marked by the 50% Fibonacci retracement level of the late December-January downfall. This is closely followed by the very important 200-day Simple Moving Average (SMA), currently around the $23.45 region, and the 61.8% Fibo. level near the $23.55 area. A sustained strength beyond the latter will be seen as a fresh trigger for bullish traders and set the stage for an extension of the recent move up from sub-$22.00 levels, or over a two-month low touched on January 22.
Given that oscillators on the daily chart have just started gaining positive traction, the XAG/USD might then aim back towards reclaiming the $24.00 round figure. The momentum could extend towards the next relevant hurdle near the $24.50-$24.60 area and the $25.00 psychological mark. Some follow-through buying has the potential to lift the white metal to the $25.45-$25.50 intermediate barrier en route to the $26.00 neighbourhood, or the December swing high.
On the flip side, weakness back below the $23.00 mark might continue to find some support near the $22.55 area, which if broken decisively will suggest that a nearly two-week-old uptrend has run its course and shift the bias back in favour of bearish traders. The XAG/USD might then turn vulnerable to retest the $21.95-$21.90 region, or a two-month low, before eventually dropping to the $21.40-$21.35 area en route to the $21.00 mark and the $20.70-$20.65 zone, or the October swing low.
Silver daily chart

Technical levels to watch
