GBP/USD Price Analysis: Bearish kicker candlestick favors a reversal
- BOE’S dovish guidance has snapped a four-day rally in the Cable.
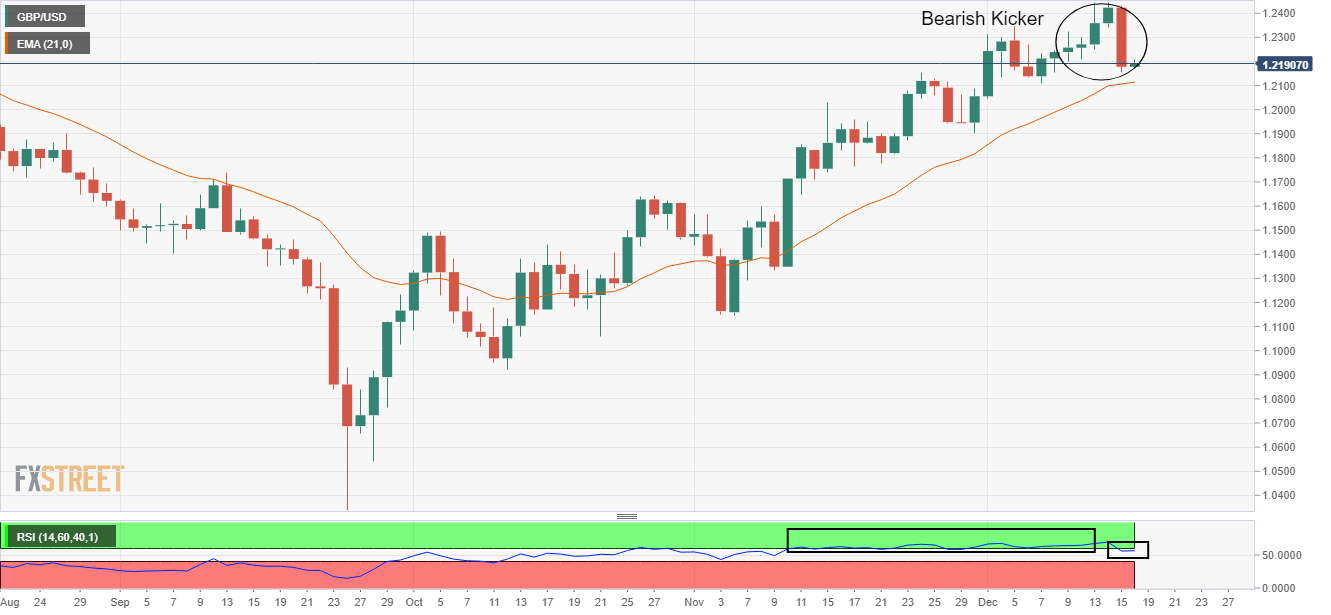
- A Bearish Kicker candlestick pattern that indicates a reversal after an upside trend.
- The RSI (14) has slipped into the 40.00-60.00 range, which indicates a loss in the upside momentum.
The GBP/USD pair has witnessed a rebound after dropping to near 1.2156 on Thursday. The cable went through a sheer sell-off after the Bank of England (BOE) Governor Andrew Bailey sounded dovish on interest rate guidance after hiking current borrowing cost by 50 basis points (bps) to 3.50%.
Meanwhile, the US Dollar Index (DXY) has corrected in its early trade to near 104.45 amid negative market sentiment. Investors have underpinned THE risk aversion theme amid rising recession fears after a hawkish Federal Reserve (Fed) policy.
On a daily scale, the Cable has formed a Bearish Kicker candlestick pattern that indicates a reversal after an upside trend. Sheer volatility in the Pound Sterling has snapped a four-day rally in the Cable. The 20-period Exponential Moving Average (EMA) at 1.2115 has not been tested yet, therefore the short-term trend is still solid.
Meanwhile, the Relative Strength Index (RSI) (14) has slipped into the 40.00-60.00 range from the bullish range of 60.00-80.00, which indicates a loss in the upside momentum.
Investors might see selling pressure near the round-level resistance of 1.2200, which will drag the asset toward December 7 low at 1.2107. A breakdown of the latter will expose the Cable for more downside toward November 15 high at 1.2029.
For an upside move, the Cable needs to surpass December 5 high of around 1.2344, which will drive the asset toward Tuesday’s high at 1.2444, followed by the psychological resistance at 1.2500.
GBP/USD daily chart